Per il secondo anno pubblichiamo il Bilancio di Responsabilità Sociale
per testimoniare la volontà di farci conoscere meglio dai nostri stakeholder (i clienti, i fornitori, la comunità territoriale,
ma anche i nostri dipendenti), condividendo sie le informazioni economiche che quelle di natura sociale ed ambientale, migliorando la trasparenza ed
arricchendo il confronto interno ed esterno.
La forma scelta è quella di un bilancio che sia il più possibile semplice ma allo stesso tempo comunicativo,
senza troppi giri di parole ma contenente tutte le informazioni utili per poter valutare il nostro operato.
Abbiamo privilegiato la pubblicazione di tabelle, grafici ed indicatori quantitativi e qualitativi coerenti con le
principali linee guida nazionali ed internazionali.
La scelta di adottare una pagina web invece di un documento PDF deriva dalla volontà di tenere il Bilancio costantemente aggiornato,
oltre che di garantire facilità di lettura ed interattività della navigazione.
La pubblicazione di questo Bilancio vuole essere un'iniziativa in continuità con il nostro percorso di miglioramento costante nei rapporti con i nostri stakeholder,
adottando prassi aziendali basate sempre di più sui principi dello sviluppo sostenibile.
For the first time we have decided to publish the Sustainability Report with the aim to testify our will to be better known by our stakeholders (customers, suppliers, the community, our employers as well) sharing both economical, social and environmental information,
improving our directness and enriching the internal/external relations.
We have chosen the form of a report which is as simple as possible, can be at the same time communicative, gets to the point and contains all the useful information for the evaluation of our work.
We have privileged the publication of charts, plans and quantitative/
qualitative indexes, in conformity with the principal national and international guidelines.
The choice of adopting a web page, instead of a PDF document, originates from our will to constantly update the report and to allow reading facility and web surfing interactivity
This report publication aims to improve the relationship to our stakeholders, adopting a company approach based more and more on the principles of sustainable development.
Il nostro bilancio si rifà alle linee guida GRI e GBS , seguendone la struttura e i contenuti principali.
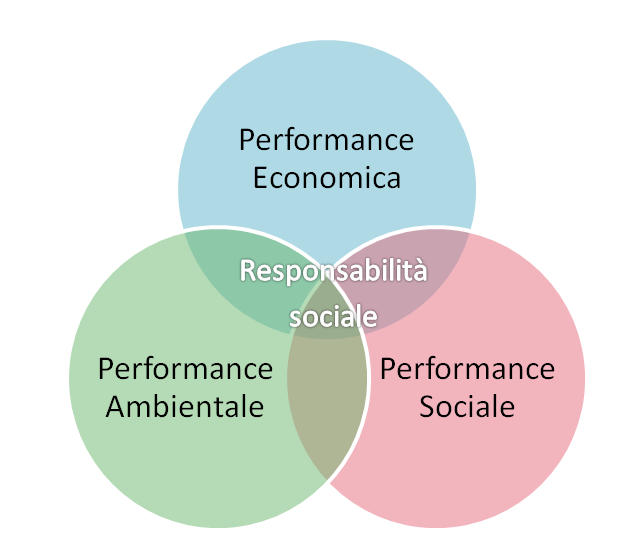
Secondo le linee guida, lo sviluppo sostenibile di un'azienda è un processo di miglioramento delle performance economiche,
sociali ed ambientali: la sostenibilità è data dall'esito della gestione di questo processo.
Nel nostro report, dopo aver esplicitato la nostra identità,
affronteremo queste tre dimensioni riportandone i principali indicatori di performance ed approfondendo alcuni aspetti che riteniamo significativi.
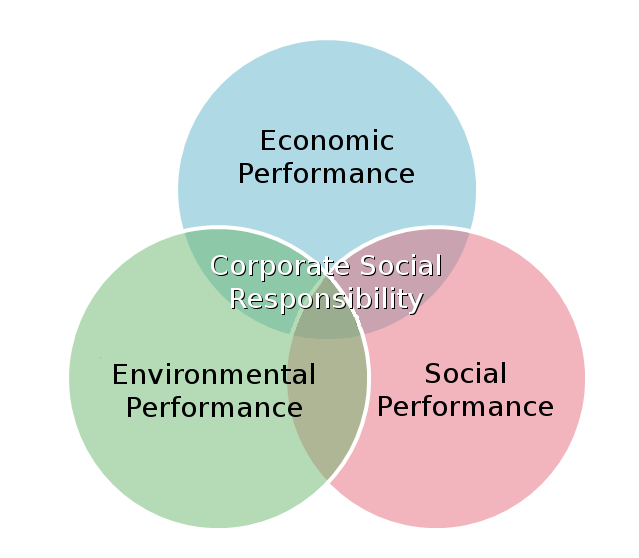
Our report follows the GRI and GBS guidelines following their structure and main contents.
According to the guidelines, the sustainable development of a company is an improvement process of the economic, social and environmental performances: sustainability comes out from the result of the management of these processes.
After introducing our company, we will deal, in our report, with these three dimensions, by reporting the main performance indexes and by
examining some aspects which we consider more relevant.
Chi siamo e cosa facciamo: la nostra storia, la nostra azienda, i nostri valori Who we are and what we produce: our history, our company , our values
Come creiamo valore aggiunto e come lo redistribuiamo ai nostri stakeholder The way we create economic value and the way we redistribute it to our stakeholders
Le politiche nei confronti dei nostri stakeholder
The policies towards our stakeholders
La nostra strategia di sostenibilità ambientale Our environmental sustainability strategy
La Nicolini & C. nasce nel 1973 per iniziativa dei sig.ri Nicolini Mario, Reggiani Luciano e Nicolini Luigi con lo scopo di produrre motori elettrici e componenti. Fin dall’inizio la concezione lavorativa che ha caratterizzato l’azienda è stata indirizzata ad ottenere la soddisfazione del cliente fornendogli un prodotto di qualità ed un servizio efficiente. Oltre a ciò vi è sempre stato, nella Nicolini & C., la consapevolezza che fosse necessario rinnovare continuamente le tecnologie produttive e contemporaneamente adeguare il prodotto alle tendenze del mercato. Questa filosofia imprenditoriale ha prodotto, con il passare degli anni, una crescita graduale cha ha consentito la formazione di personale qualificato e l’acquisizione di una clientela stabile e affezionata. Oltre al consolidamento della posizione di primo piano a livello nazionale, la Nicolini & C. ha acquisito una prestigiosa clientela nei mercati europei tecnologicamente avanzati e sta indirizzando i propri sforzi ai mercati intercontinentali per i quali sono state messe a punto nuove linee di prodotto nel rispetto dei requisiti tecnici previsti dalle normative dei singoli paesi. Possiamo ora affermare che la Nicolini & C. è un’azienda consolidata e con l’ingresso in azienda della terza generazione offre ulteriori prospettive di crescita. Nicolini & C. was established in 1973, thanks to the initiative of Mr.Nicolini Mario,Mr.Reggiani Luciano and Mr. Nicolini Luigi, with the purpose to produce electric motors and components Since the very beginning the working concept characterizing the company aimed to the customers satisfaction through the supply of a quality product and an efficient service. Moreover, Nicolini has always been convinced of the necessity to constantly renew the productive technologies and to update the products according to the market trends. This business philosophy produced, over the years, gradual growth that has allowed the training of skilled staff and the acquisition of a solid and loyal clientele. Besides the reinforcement of a prominent position on a national level, Nicolini & C. has acquired an eminent clientele in the technological advance European markets and we are addressing our effort towards the intercontinental markets for which new product lines has been developed, in conformity with the technical features required by the regulations of each country We can now state the Nicolini & C. is a consolidated company: the third generation is now leading the business offering further growth prospects.
Voglio saperne di piùTell me moreRIEPILOGO DEI PRINCIPALI INDICATORI DI SOSTENIBILITA'SUMMARY OF THE MAIN SUSTAINABILITY INDICATORS
Creazione e redistribuzione del Valore Aggiunto Creation and distribution of economic value
Nel 2017 il bilancio della Nicolini & C è stato chiuso con un fatturato di 8.336.788 € e
un utile netto di 734.029 €.
In 2016 Nicolini & C balance was closed with a turnover of 8.336.788 € e
and a net profit of 734.029 €.
Il “Valore Aggiunto” indica la capacità di un’azienda di generare ricchezza e di redistribuirla tra i suoi
stakeholder, e rappresenta il collegamento tra il Bilancio Economico e il Bilancio Sociale,
in quanto riclassifica le informazioni contabili esplicitandone la valenza sociale.
Il modello adottato per il calcolo del VA è quello del gruppo GBS e consiste, nello specifico nel
calcolare la ricchezza come differenza tra il valore della produzione e i costi relativi all’acquisizione
di beni e servizi. Il Valore Aggiunto Globale è stato calcolato aggiungendo il saldo della gestione
straordinaria ed accessoria.
The economic value of a company indicates the ability to generate wealth and to redistribuite it among its stakeholders, represents the link between the Economic Statement and the Social report, as it re-classifies the accounting information expressing its social worth.
The model adopted for calculation of AV is the one of the GBS group and it consists, specifically, in calculating wealth as the difference between the value of production and the costs referring to the acquisition of goods and services
The global economic value has been calculated adding the balance of
the extraordinary and accessory management.
2017 | 2016 | 2015 | 2014 | 2013 | |
---|---|---|---|---|---|
Valore della produzioneValue of the production | 8.504.682 | 7.188.846 | 6.929.544 | 7.136.431 | 6.119.385 |
Costi intermedi della produzioneIntermediate costs | 5.811.430 | 4.939.799 | 4.933.146 | 4.964.287 | 4.176.687 |
VALORE AGGIUNTO CARATTERISTICO LORDOOPERATIONAL ECONOMIC VALUE | 2.693.252 | 2.249.047 | 1.996.398 | 2.067.144 | 1.802.698 |
Componenti accessori e straordinariExtraordinary and accessory components | -8.154 | -5.849 | 158.243 | -70.181 | -139.601 |
VALORE AGGIUNTO GLOBALE LORDOGROSS GLOBAL ECONOMIC VALUE | 2.685.098 | 2.243.198 | 2.154.641 | 2.101.963 | 1.803.097 |
La distribuzione del Valore Aggiunto rappresenta la quantità di ricchezza che l’azienda redistribuisce verso ognuno dei suoi Stakeholder.
The distribution of the Economic Value represents the wealth quantity the company redistributes to each of its stakeholder.
2017 | 2016 | 2015 | 2014 | 2013 | |
---|---|---|---|---|---|
Risorse umaneHuman Resources | 57,6% | 64,8% | 63,8% | 60,6% | 67,3% |
Stato, enti e istituzioniState, organizations and institutions | 11,4% | 9,2% | 7,4% | 11,5% | 9,6% |
Remunerazione del capitale di creditoRemuneration of credit assets | 0,0% | 0,2% | 0,2% | 0,3% | 0,0% |
Remunerazione dei soci e degli amministratoriRemuneration of associates and administrators | 5,2% | 4,7% | 4,9% | 6,7% | 5,8% |
Remunerazione dell'aziendaRemuneration of the company | 25,8% | 21,3% | 23,8% | 20,9% | 17,0% |
Dall'analisi degli indici di bilancio si evidenzia come la capacità da parte della nostra azienda di garantirsi autonomamente le risorse finanziarie sia ormai consolidata. Positiva e stabile è la redditività della gestione aziendale nel suo complesso (ROE), risulta positiva anche la redditività della gestione caratteristica rispetto all'intero finanziamento aziendale ovvero la redditività del capitale investito (ROI). Quest'ultimo poi risulta sempre maggiore del livello di indebitamento e quindi non si ricorre all'effetto leva finanziaria (ROI>ROD). Gli indici di liquidità mostrano che sia nel breve che nel lungo termine sono disponibili risorse finanziarie sufficienti per far fronte ai debiti. Infine il Capitale Circolante Netto è sempre positivo ciò rappresenta il surplus di risorse monetarie che l'azienda ha investito in eccedenza rispetto al passivo corrente. Il CCN assieme ai precedenti indici forniscono la misura dell'equilibrio finanziario , la dimensione della sua stabilità e mostrano un'impresa con ottimi livelli di liquidità e solidità nel breve termine ma anche duraturi sul lungo periodo. From the analysis of the financial statement we can point out that the ability of our company to guarantee autonomously the financial resources is already consolidated. The profitability of the company management on the whole(ROE) is positive and stable; profitability of the characteristic management in respect to the whole company financing, that is to say the profitability of the invested assets, results positive as well. Moreover, this latter results always superior to the debit load and therefore it is not necessary to turn to the effect financial leverage (ROI>ROD). The current assets indexes show that both in the short and in the long run we dispose of sufficient financial resources to face debts. At the end the Net Circulating Assets (CCN) is always positive, this represents the monetary resources surplus that the company invested in excess in relation to the current loss. The CCN together with the previous indexes produce the measure of the financial balance, the dimension of its stability and show a company which has ,not only in the short but also in the long run, excellent long lasting current assets and solidity levels.
IndiciIndexes | 2013 | 2014 | 2015 | 2016 | 2017 |
---|---|---|---|---|---|
ROE | 16,78% | 22,62% | 20,66% | 16,58% | 21,50% |
ROI | 10,38% | 14,26% | 9,92% | 12,31% | 14,05% |
Quoziente di indebitamentoLeverage | 0,18 | 0,11 | 0,01 | 0,00 | 0,00 |
Indice di liquidità correnteCurrent liquidity index | 1,96 | 1,86 | 1,06 | 2,26 | 2,36 |
CCN | 1.373.244 | 1.354.687 | 1.791.637 | 2.212.416 | 3.074.305 |
Dipendenti, clienti, collettivitàEmployees, customers, community
Tra il 2014 e il 2018 il personale è aumentato di 7 unità, di cui 5 operai e 2 impiegati. La presenza femminile in azienda è del 38%, 10 sono operaie e 5 sono impiegate.
Between 2013 and 2015 the staff increased of 5 units, 5 of these are workers, 2 are clerks.
The feminine presence in the company is 38%, 10 are workers, 5 are clerks.
Di seguito si riporta un riepilogo dei principali indicatori secondo le linee guida GRI
Here follows a brief summary of the most important indexes according to GRI guidelines
2014 | 2015 | 2016 | 2017 | 2018 | |
---|---|---|---|---|---|
Numero di dipendentiNumber of employers | 33 | 37 | 38 | 40 | 40 |
Numero di operaiNumber of workers | 26 | 28 | 28 | 31 | 31 |
Numero di impiegatiNumber of clerks | 5 | 7 | 8 | 7 | 7 |
Numero di intermediNumber of middle management staff | 2 | 2 | 2 | 2 | 2 |
Numero di donneNumber of women | 11 | 12 | 13 | 15 | 15 |
% donne sul totale% of women on the totality of the employees | 33% | 32% | 34% | 38% | 38% |
% donne sul totale operai% of women on the totality of the workers | 27% | 25% | 25% | 35% | 32% |
% donne sul totale impiegati% of women on the totality of the clerks | 57% | 56% | 56% | 56% | 56% |
Numero di dipendenti a part-timeNumber of part-time employees | 5 | 5 | 5 | 5 | 5 |
% dipendenti part-time sul totale% of part-time employees on the totality | 15% | 14% | 16% | 12% | 12% |
% donne sul totale a part-time% of women on the totality of the part-time employees | 100% | 100% | 100% | 100% | 100% |
% donne part-time sul totale donne% of part-time women on the totality of the women | 45% | 42% | 38% | 31% | 33% |
Età mediaAverage age | 42 | 43 | 44 | 41 | 43 |
Numero di dipendenti under 45Number of under 45 | 19 | 18 | 19 | 22 | 21 |
% under 45 sul totale dipendenti% of under 45 on the totality of the employees | 58% | 58% | 58% | 55% | 53% |
Media anni di presenza in aziendaAverage years of presence in the company | 14 | 14 | 13 | 11 | 12 |
Anni di presenza operaiAverage years of presence of the workers | 10 | 10 | 11 | 10 | 11 |
Anni di presenza impiegatiAverage years of presence of the clerks | 29 | 24 | 18 | 11 | 12 |
Numero di dipendenti extracomunitariNumber of non-EU employees | 7 | 7 | 7 | 5 | 5 |
% extracomunitari sul totale dipendenti% of non-UE on the totality of the employees | 21% | 19% | 18% | 12% | 12% |
Numero di dipendenti a tempo indeterminatoNumber of open-ended employees | 28 | 31 | 31 | 35 | 40 |
% a tempo indeterminato sul totale dipendenti% of open-ended on the totality of the employees | 85% | 84% | 82% | 87% | 100% |
Numero di lavoratori interinaliNumber of temporary workers | 5 | 3 | 0 | 1 | 0 |
Personale in ingressoEntering employees | 4 | 7 | 1 | 8 | 4 |
Nuove assunzioni a tempo determinatoNew fixed term hirings | 3 | 4 | 1 | 5 | 0 |
Nuove assunzioni a tempo indeterminatoNew open-ended hirings | 1 | 3 | 0 | 3 | 4 |
Personale in uscitaLeaving employees | 2 | 3 | 0 | 5 | 4 |
Tasso di turnoverLabour turnover rate | 18% | 27% | 3% | 32% | 10% |
Tasso di compensazione turnoverLabour turnover compensation rate | 200% | 233% | - | 166% | 100% |
CLIENTICUSTOMERS
Il rapporto con i nostri clienti è basato sulla fiducia reciproca e sulla stretta collaborazione, che ci permettono di fornire
prodotti di qualità e su misura, adattandoli alle esigenze del cliente, al quale garantiamo assistenza in tutte le fasi successive all'acquisto.
Tra i nostri clienti ci sono anche aziende leader a livello mondiale, come Bosch Rexroth, Kaercher ed Emerson.
I nostri clienti sono localizzati in più di 50 paesi diversi: nella mappa sottostante sono raffigurati in base al grado di rilevanza.
The relationship to our customers is based on reciprocal confidence
and on closed collaboration, which enable us to supply customized quality products we adapt to the requirement of the customers whom we
assure full assistance after the purchase
We can include among our customers world leader companies such as
Bosch Rexroth, Kärcher and Emerson
Our customers are located in more than 50 different countries: in the following map they are represented according to the level of their importance
Consumi, emissioni, rifiutiUse, emissions, waste
PESO E DESTINAZIONE DEI RIFIUTIWEIGHT AND WAIST DESTINATION
2014 | 2015 | 2016 | 2017 | 2018 | DestinazioneDestination | |
---|---|---|---|---|---|---|
Rifiuti non pericolosiNon-dangerous waste | 45,50 | 23,21 | 17,88 | 21,99 | 26,25 | |
Limatura e trucioli di ferroSmoothing and iron shavings | 19,09 | 9,12 | 11,23 | 8,34 | 12,80 | RecuperoRe-used |
Imballaggi di carta e cartonePaper and carton packing | 7,11 | 6,98 | 6,15 | 6,99 | 8,84 | RecuperoRe-used |
Fusioni di alluminioAlumium melting | 4,22 | - | - | 3,67 | - | RecuperoRe-used |
Rottami di ferro e acciaioSteel and iron scraps | 13,98 | - | - | - | 2,23 | RecuperoRe-used |
Apparecchiature fuori usoSOut of use devices | - | 6,57 | - | 2,99 | - | RecuperoRe-used |
Scarti di verniciaturaPainting waste | - | 0,54 | 0,50 | - | - | SmaltimentoDisposal |
Rifiuti pericolosiDangerous waste | 1,46 | 0,97 | 0,76 | 1,60 | 0,81 | |
Emulsioni oleose non contenente alogeniOily suspensions | 0,90 | 0,40 | 0,08 | 1,02 | 0,13 | SmaltimentoDisposal |
Fanghi solidi di rettifica materiali ferrosiSolid slurries from iron materials grinding | 0,56 | 0,57 | 0,68 | 0,58 | 0,68 | StoccaggioStorage |